
We’re All in This to Get There

As returning scholars might remember, some big projects take much too long to finish—high speed rail in California, the Haunted Chocolatier, these outlines. Some never get there at all. Explore the following examples of projects that weren’t finished on time, then discuss with your team: What factors, if any, did these delays have in common? How would you have overcome them? And are there projects out there in the world today that you predict will suffer a similar fate?
California High-Speed Rail (CAHSR) is a publicly funded high-speed rail system being developed in California by the California High-Speed Rail Authority. Phase 1, about 494 miles (795 km) long, is planned to run from San Francisco to Los Angeles and Anaheim via the Central Valley, and is partially funded and under construction. A proposed Phase 2 would extend the system north to Sacramento and south to San Diego, for a total of 776 miles (1,249 km). The project was authorized by a 2008 statewide ballot to connect the state's major urban areas and reduce intercity travel times. Phase 1 targets a nonstop travel time of 2 hours and 40 minutes from San Francisco to Los Angeles (wow! This is usually a 45-minute flight or 7-hour drive!), compared to about nine hours on the existing Amtrak San Joaquins. California legislative overseers do not expect the 2 hr 40 min target will be achieved. Due to limited funding, the project is being built in sections. Supporters of the project state that it would alleviate air traffic and highway congestion, reduce pollution and greenhouse gas emissions, and provide economic benefits by linking the state's inland regions to coastal cities.

The 2008 California voter approval required the project to be financed with matching funds from other sources, including private and federal. The government of Japan offered long-term, low-interest financing if California employed Shinkansen bullet-train technology. The project is now financed mainly by the state of California, supplemented by federal grants. By the end of 2023, the share of committed funding borne by the state was 76%. The Authority has only one source of persistent cash flow: a fixed share of revenue from California cap-and-trade (Carbon emission trading) auctions set to expire in 2030. Operation is expected to start 2031-2033 on the IOS (Merced to Bakersfield). The project faced many technical and funding challenges. Funding wise, buying property for the tracks was seriously delayed; this might be one of the reasons why the line runs through Central Valley instead of heavily populated cities. Another issue was finding the right type of trains; Elon Musk even proposed hyperloop, but that was technologically unproven. To save costs some sections of the tracks are planned to operate on a blended system with slower trains and high-speed trains sharing one line.
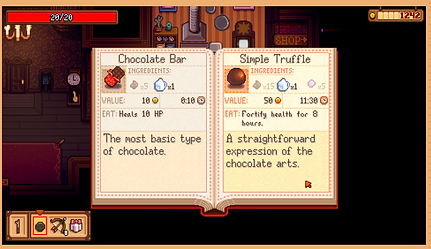
Haunted Chocolatier is a planned chocolatier simulation video game by ConcernedApe, the developer of Stardew Valley. As of March 2026, the game is in development but has no set release date. Eric Barone, known professionally as ConcernedApe, began to develop Haunted Chocolatier in 2020, following his hit game Stardew Valley.
Haunted Chocolatier is a simulation game with action role-playing elements. The player's character runs a confectionery store. The player collects ingredients to make chocolate confections while also interacting with town locals and ghosts. The player can pursue romantic relationships with non-player characters and can customize the layout of their store.
On the official website, Ape has recently posted some updates as of Jan 2026. To debunk a few myths and false assumptions I’ve seen:
“Haunted Chocolatier will be abandoned and the content will be added to Stardew Valley instead”
No. First, I am not going to abandon Haunted Chocolatier. But even if I did, I am not going to add it to Stardew Valley. Stardew Valley and Haunted Chocolatier are separate games. It doesn’t even make sense from a technical perspective, as Haunted Chocolatier is written from scratch, it’s not the same “engine” as Stardew Valley. You can’t just copy and paste Haunted Chocolatier into Stardew Valley.


La Sagrada Familia | Spain
For unfinished, pending projects, this one probably gets the record. 143 years ago, Bishop Urquinaona laid the cornerstone of the Temple for what would become one of the most ambitious and defining architectural projects of the 20th century. La Sagrada Família in Barcelona is a one-of-a-kind Catholic basilica designed by renowned Spanish architect Antonio Gaudí.
Currently the oldest active construction project, five generations of Spaniards have watched the largest unfinished Catholic church in the world grow within the Eixample district. Originally designed by Francisco de Paula del Villar in 1882, Gaudí took over the project the following year, and completely reinvented the designs by combining Gothic and Art Nouveau influences to give the basilica its distinctive style. The design became the fruit of his life’s work, and he envisioned the construction of the Sagrada Família as a centuries-long project, akin to the great cathedrals of medieval Europe.
But upon entering the cathedral, visitors are stunned by the bright colours of its interiors – stained glass windows paint the walls in shades of red, green, blue, and yellow. Because the windows are

arranged so the brighter colours are at the bottom and translucent windows are at the top, the colours on the walls change shades throughout the day, looking cooler in the morning and warmer in the evening. Although Gaudí died in 1926 while less than a quarter of the construction was completed, his body was interred in the crypt of the church.
Construction progressed slowly, and was particularly disrupted by the Spanish Civil War and when the FAI set fire to the crypt and partially destroyed Gaudí’s original plans in 1936. Luckily reconstructions of the plans were able to be made, and the church made intermittent progress through the 1950s until the 21st century.


Luckily with technology, the project has picked up its pace. Computer models, and precise computer numerical control (CNC) machined stonework are utilized instead of traditional craftsmen. Recent additions to the building include a 12-pointed crystal star atop one of the main towers, elaborate facades and doors, and a magnificent organ. And once the Jesus Christ spire is added on to the roof, Sagrada Família will become the tallest church building in the world – 11 metres (36.1 ft) taller than the current record-holder, Ulm Minster. Builders confirmed they are still on schedule for a 2026 completion of the structure, with aesthetic work to be completed by the 2030s.
Nusantara Capital City | Indonesia
Indonesia’s new capital falls victim to the politics of forgetting. In the final years of Joko Widodo’s presidency, Nusantara —Indonesia’s new capital in East Kalimantan —was hailed as a bold experiment in nation-building. Conceived as a sustainable smart city meant to redistribute growth beyond Java’s overburdened plains.
The project is estimated to be worth Rp 523 trillion (US$35 billion) and will be built in five phases lasting until 2045, to coincide with the 100th anniversary of Indonesia. Phase 1,

known as the "Main Governmental Area" zone, started in August 2022. By the end of Joko Widodo's presidency, many buildings had been completed such as the State Palace, ministry offices, residential buildings, monuments and parks, as well as projects outside the government budget such as hotels, hospitals, and PSSI training centre. On 17 August 2024, Indonesia officially celebrated its Independence Day for the first time in Nusantara. Nusantara has attracted tourism, with daily visitors ranging between 3,000 and 5,000. The project continued during the presidency of Prabowo Subianto, who has allocated Rp 48.8 trillion (US$2.98 billion) for Phase 2 and has decided to include Nusantara as one of Indonesia's 2025–2029 National Strategic Projects.

However, for a project that was meant to define Indonesia’s century, Nusantara’s quiet disappearance from the political stage is as telling as it is symbolic. Prabowo’s priorities are fundamentally different. His presidency, shaped by decades of military thinking and nationalistic rhetoric, orbits around three imperatives: food security, energy sovereignty and defense modernization.
Ryugyong Hotel | North Korea
The Ryugyong Hotel or Yu-Kyung Hotel, is a 330 m (1,080 ft) tall unfinished pyramid-shaped skyscraper in Pyongyang, North Korea. Its name (lit. "capital of willows") is also one of the historical names for Pyongyang. The building has been planned as a mixed-use development, which would include a hotel.
Construction began in 1987 but was halted in 1992 as North Korea entered a period of economic crisis after the dissolution of the Soviet Union. After 1992, the building stood topped out, but without any windows or interior fittings. In 2008, construction resumed, and the exterior was completed in 2011. The hotel was planned to open in 2012, the centenary of founding leader Kim Il Sung's birth. A partial opening was announced for 2013 and subsequently cancelled. In 2018, an LED display was fitted to one side, which is used to show propaganda animations and film scenes.

A rusting construction crane remained at the top, which the BBC called "a reminder of the totalitarian state's thwarted ambition". According to Marcus Noland, in the late 1990s, the European Chamber of Commerce in Korea inspected the building and concluded that the structure was irreparable. Questions were raised regarding the quality of the building's concrete and the alignment of its elevator shafts, which some sources said were "crooked".
Activity resumed in late 2016 and a representative of Egyptian construction company Orascom visited North Korea. In 2017 and early 2018, there were signs of work at the site, with access roads being constructed. In 2024, the North Korean government reportedly started to look for a casino operator willing to complete the building in exchange for profits made by the casino.
Wonderland Amusement Park | China
Wonderland was an unfinished amusement park project located in Chenzhuang Village (陈庄村), Nankou Town (南口地区), Changping District, Beijing, China. Originally proposed by the Thailand-based property developer Reignwood Group,and designed to be the largest amusement park in Asia (to have covered 120 acres (49 ha)), construction stopped in 1998 following financial problems with local officials, while a 2008 attempt to start construction again also failed. The site featured a number of abandoned structures, including the framework of a castle-like building and medieval-themed outer buildings. Land was reclaimed by local farmers to grow their various crops while the site was abandoned. People have reported when visiting the site that, sometimes, there would still be parking attendants in the site's parking lot, presumably to tend to onlookers and curious sightseers that came to visit. The abandonment of such a massive construction project raised concerns about the existence of a property bubble in China. The incomplete and abandoned structures were demolished in May 2013, leaving no hope for the abandoned park to ever be finished.


The construction of Berlin Brandenburg Airport "Willy Brandt" (BER) is widely considered one of the biggest and most embarrassing infrastructure failures in post-war German history. What was meant to be a "flagship project" showcasing German efficiency turned into a 15-year saga of planning errors, technical flaws, and management chaos.
The airport's history is marked by a series of abandoned opening dates. Originally, it was scheduled to open on October 30, 2011. Just weeks before the planned opening in June 2012, the inauguration was abruptly canceled. The
Berlin Brandenburg Airport | Germany

official reason was a critical fire safety system defect (the smoke extraction system was designed to blow smoke down into the hall rather than up and out), along with tens of thousands of incorrectly installed cables. Following this, a domino effect of delays occurred. New opening dates in 2013, 2014, 2017, and 2018 were all publicly announced and subsequently abandoned due to insolvent construction firms, endless design changes, and legal battles. The airport finally opened on October 31, 2020—9 years behind schedule—during the COVID-19 pandemic.
The project was initially budgeted at approximately €2.0 to €2.5 billion. However, the final construction cost ballooned to roughly €6.0 to €7.0 billion. Also, the project was plagued by a long list of absurd technical and management failures:
-
The Fire System: The fire safety system was the main culprit. It was later revealed that the system had been designed by a draftsman, not a licensed engineer.
-
Miscalculations: The escalators were too short to bridge the gap between floors. Over 750 of the 900 planned display screens had to be scrapped before the airport even opened.
-
Bureaucratic Nonsense: There were cases where doors were given incorrect numbers, making it impossible for rescue services to find the correct room in an emergency. Despite its disastrous start, BER is now fully operational. It officially replaced the old airports (Tegel and Schönefeld) in late 2020.


Milan Cathedral | Italy
The cathedral took nearly six centuries to complete: construction began in 1386, and the final details were completed in 1965. It is the largest church in the Italian Republic. There is a long list of names of all the people involved over the six centuries of construction.
Several factors contributed to the cathedral's legendary construction timeline:
-
Lack of Funds and Vision: Progress was "sporadic" for 500 years primarily due to "a lack of funds and ideas". The project was often left idle when money ran out or when patrons died, such as after the death of Gian Galeazzo Visconti in 1402.
-
Architectural Disputes: The sheer scale and complexity of the building led to constant disagreements. For over a century, architects debated how to build the central crossing tower (tiburio) without it collapsing. Both Leonardo da Vinci and Donato Bramante submitted designs to solve this problem.
-
Changing Styles and Oversight: Because it took so long to build, the architectural style changed over time. While it began as a pure Gothic structure (imported from France and Germany), later additions in the Renaissance, Baroque, and Neoclassical styles were incorporated, creating a unique blend. A dedicated institution, the Veneranda Fabbrica del Duomo, was founded in 1387 to oversee the project and still exists today.
Crazy Horse Memorial | South Dakota
The controversial 70-year journey to build Crazy Horse, the world's largest monument that still isn't finished.
-
In 1948, work began on a sculpture in South Dakota to honor Native American warrior Crazy Horse.
-
Polish American sculptor Korczak Ziolkowski designed the sculpture, thinking it would take 30 years to build.
-
It's now been 71 years, and it's not nearly finished.
-
The finished version will be 563 feet high and 641 feet long and show a Native American warrior with long hair sitting on horseback.
-
Some people are concerned the memorial is now as much about the Ziolkowski family as it is about honoring a Native American hero.
Crazy Horse is famous for being one of the leaders in a victory against the US army in the Battle of Little Bighorn in 1876. He's also known for his humility, and some people have questioned whether he would have liked having a replica the size of a mountain.
Some say the project's construction has become more about sculptor Korczak Ziolkowski and his family, who have devoted their lives to the sculpture, rather than focusing on the Native Americans it's meant to honor. Ziolkowski first worked on Mount Rushmore, but left when he clashed with the sculptor's son. Standing Bear wrote to Ziolkowski after a
sculpture he'd made won first prize at the New York World Fair in 1939. Standing Bear said there needed to be a Native American memorial in response to Mt Rushmore. "My fellow chiefs and I would like the white man to know that the red man has great heroes also," he said.
Ziolkowski spent his life working on the granite, but he did not live to even see the finished face. "Go slowly, so you do it right," he told his second wife. He thought it would take 30 years. It's now been 71 years, and it's far from finished. When Ziolkowski started work in 1948, he had less than $200. He also had to deal with no roads, water, or electricity. Ziolkowski was consumed by the project, and his first wife divorced him because of it. But in 1950, he married Ruth Ross, who had come to South Dakota two years earlier to volunteer on the project. The wedding was on Thanksgiving, so he didn't need to take an extra day off from sculpting the mountain.
They had a large family — 10 children, seven of whom went onto work on the enormous project. Ziolkowski was always honest about his focus on the sculpture. He told his wife she would always come second to it, and his children would come third. He also said that if his children left, they shouldn't bother to come back.
He worked alone for years to sculpt the mountain. In comparison, Mt. Rushmore had 400 workers, and $1 million of funding. He died and his wife and family carried on his legacy. In 1998, 50 years after beginning work on the memorial, Crazy Horse's head was unveiled. It is 87 feet high and 58 feet wide, with eyes that are 17 feet apart. After the unveiling of the face, work has steadily continued, but there aren't many people actually working on the mountain. As of 2007, there were four drilling and blasting workers and one foreman. There's also been some discomfort around a non-Native American family profiting from a history that isn't theirs. When it is finally finished, the memorial will be just under four times the height of the Statue of Liberty, and far bigger than any individual.
The science of project management aims to prevent delays and failures like those above. And, while it’s only been formally studied in recent centuries, project management itself isn’t a new concept. The makers of the Egyptian pyramids had to deploy a large workforce. China built a notable wall. The Romans devised their roads. Medieval cathedrals reached breathtaking heights. All of these things were complex operations that had to be managed somehow. Consider the history of project management, then discuss with your team: are such megaprojects harder to build now than in the past?
Ancient Beginnings: The Origins of Project Management
Ancient civilizations pulled off monumental projects required careful planning, organization, and execution. Some of the earliest examples include the Great Pyramid of Giza (circa 2580-2560 BC), the Great Wall of China (7th century BC – 16th century AD) and Roman Roads and Aqueducts (circa 312 BC – AD 226). I am guessing a lot of what led to the success of these projects was slavery and dictatorship.
The Birth of Modern Project Management: The 20th Century
Modern project management emerged in the 20th century with the rise of industrialization and large-scale engineering projects. Key milestones include:
-
The Gantt Chart (1910s): Henry Gantt, an American engineer and management consultant, developed the Gantt chart to improve project scheduling and monitoring. This tool, still widely used today, allows project managers to visualize tasks, deadlines, and dependencies, making it easier to track progress and allocate resources.
-
The Critical Path Method (CPM) and Program Evaluation and Review Technique (PERT) (1950s): Developed during the 1950s, CPM and PERT revolutionized project planning by introducing systematic approaches to scheduling tasks. CPM, developed by DuPont, focused on determining the longest path of dependent tasks to predict project duration, while PERT, developed for the U.S. Navy's Polaris missile project, added a probabilistic element to project scheduling, accounting for uncertainty in task durations.
-
The Formation of Project Management Institutions (1960s – 1970s): In 1969, the Project Management Institute (PMI) was founded in the United States, marking the beginning of project management as a recognized profession. PMI established standards, provided certifications, and fostered a community of professionals dedicated to advancing the field. In 1981, PMI published its first edition of the "Project Management Body of Knowledge" (PMBOK), which has since become a cornerstone of project management education.
The Rise of Methodologies: Waterfall, Agile, and Beyond
The latter half of the 20th century saw the development of various project management methodologies, each catering to different types of projects:
-
Waterfall (1970s): The Waterfall model, often used in software development, is a linear and sequential approach where each phase must be completed before moving on to the next. It emphasizes documentation and thorough planning but can be inflexible when dealing with changes.
-
Agile (1990s): In response to the limitations of Waterfall, Agile methodologies emerged in the 1990s, prioritizing flexibility, collaboration, and iterative progress. Agile, with its focus on adapting to change, quickly became popular in software development and beyond, emphasizing continuous delivery and customer feedback.
-
Lean and Six Sigma (1980s – 2000s): Lean principles, originating from Toyota’s production system, and Six Sigma, a quality management methodology, have influenced project management by focusing on efficiency, waste reduction, and process improvement. These methodologies have been integrated into various industries, driving improvements in both manufacturing and service delivery.
The Digital Age: Tools, Software, and the Future of Project Management
The 21st century has seen an explosion of digital tools and software that have transformed project management. Cloud-based platforms like Asana, Trello, and Microsoft Project enable teams to collaborate in real time, track progress, and manage tasks from anywhere in the world. Automation, data analytics, and artificial intelligence are beginning to play significant roles, allowing project managers to make data-driven decisions, predict project outcomes, and optimize resource allocation.


The makers of the pyramids might have benefitted from a Gantt chart—an approach invented in the early 20th century which shows a project schedule in the form of a bar chart. Some bars represent tasks that can be worked on at the same time; others need earlier bars to be completed before you can start on them. Explore how Gantt Charts helped in the construction of the Hoover Dam in the United States and how they even became popular in the early Soviet Union, then discuss with your team: what is gained when you translate a project into this kind of format—and what is lost?
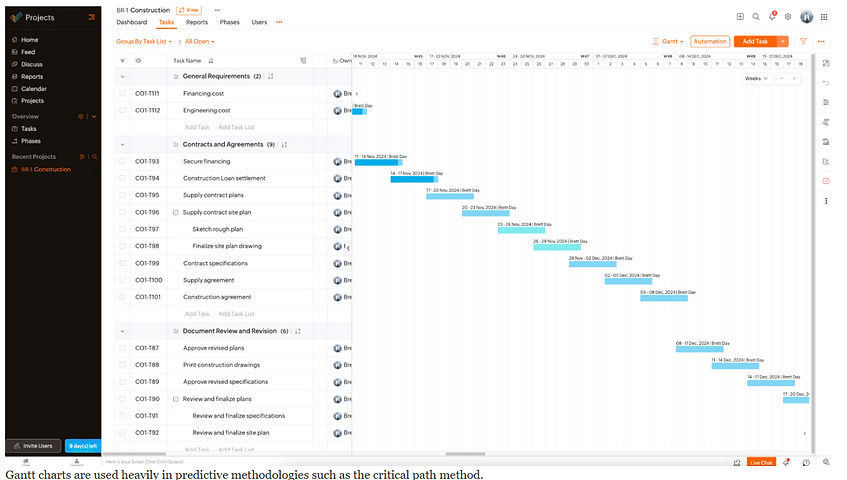
A Gantt chart is a visualization tool that uses progress bars to show a task's due dates, dependencies, roles, and milestones. The tasks are on the vertical column and the progression on the horizontal column. It makes everything clear on one chart. For projects with strict deadlines (not like writing WSC resource guides), Gnatt charts are very powerful in coordinating team collaboration and progress. In contrast, it doesn't work with Agile frameworks which focuses on adaptability, value delivery and continuous improvement (sprints).
Gantt chart advantages:
-
Provide full project overviews and help keep teams aligned
-
Help manage resources and boost efficiency
-
Show tasks and their dependencies, making complex projects manageable
-
Help leaders establish realistic deadlines for tasks and the project
-
Motivate team members as they can see their progress
Gantt chart disadvantages:
-
Can take time to configure correctly at the start of a project
-
Can lead to a confusing Gantt chart with little information displayed when involving complex projects
-
Does not take into account task difficulty or the amount of work involved
-
Can take a significant amount of time to manage when dealing with a Gantt chart with many dependencies
-
Does not list task priorities, which can lead to confusion
If you want to try building a Gantt chart for something in your life, ie. college application, personal project, or science fair, there are many templates that make it easy. Excel Gantt chart template and a Google Sheets Gantt chart template. There are also popular software apps that help with this.
-
ClickUp – Simple Gantt template
-
Monday.com – Best Gantt chart template
-
Smartsheet – Gantt chart templates
-
Asana – Gantt chart template
There is definitely a demand for professional management and developers are continuously upgrading to integrate new technology and devices.


Gnatt chart and Hoover Dam
The Hoover Dam was one of the first large-scale projects to utilize the Gantt chart for its successful execution. The project involved a consortium of six different companies working in a remote desert location with no existing infrastructure. I can imagine the colossal task project that required precision in organization from the construction of the cement mixer and railroad that transported the cement, to the different environmental challenges that required innovation.
Workers excavated four massive tunnels, each 17 meters (56 feet) in diameter and over 1 kilometer (0.6 miles) long, through the solid rock of the canyon walls. The dam required 3.25 million cubic yards of concrete. This is enough material to pave a two-lane road from San Francisco to New York City. Over 600 miles of steel pipes were embedded within these concrete blocks. Ice-cold water from a massive on-site refrigeration plant (capable of producing 1,000 tons of ice daily) was continuously circulated through the pipes to draw the heat out of the concrete. Despite challenges, the ambitious project finished 2 years ahead of schedule. It is hard to believe it was constructed nearly 100 years ago.


Walter Polakov
Walter N. Polakov is the man that brought the Gantt chart to the USSR. Polakov was a Russian-born engineer who had emigrated to the United States and became a close associate of Henry Gantt at his consulting company. In the early 20th century, the Soviet Union was eager to modernize its industry. Leaders like Lenin were surprisingly interested in "Taylorism" (Scientific Management), viewing efficiency and productivity as essential for building socialism. They saw American industrial techniques not as capitalist tools, but as scientific methods to be copied.
In 1929, as Stalin was preparing the first Five-Year Plan (a massive, centralized effort to industrialize the USSR), the Soviet government invited Walter Polakov to Moscow. His mission was to introduce the most advanced American management techniques. He brought with him the Gantt chart and began teaching Soviet planners how to use graphic methods for production scheduling and control. The Gantt chart was a perfect fit for the Soviet emphasis on Gosplan (the state planning committee).

Sleep, study, and a social life: choose two, because you can’t have all three. At least, that’s what an old student proverb would have us believe. There is a similar “Iron Triangle” in project management: scope, time, and cost. You can do something faster, but it’ll cost more or be smaller in scale. You can do something bigger, but it’ll take more time or cost more. You can do something more cheaply, but it’ll end up slower or smaller. Explore the tools below for navigating these pressures, then discuss with your team: are there times when we might want something to be smaller, slower, or more expensive?
Kanban

Kanban is a Japanese term 看版 that means signboard or billboard. An industrial engineer named Taiichi Ohno developed Kanban at Toyota Motor Corporation to improve manufacturing efficiency. Although Kanban was created for manufacturing, software development shares many of the same goals, such as increasing flow and throughput.
Visualization of work is a key principle that Kanban addresses primarily through Kanban boards. These boards use cards organized by progress to communicate overall status. Visualizing helps to easily see the big picture of where a project currently stands, as well as identify potential bottlenecks that could affect productivity.
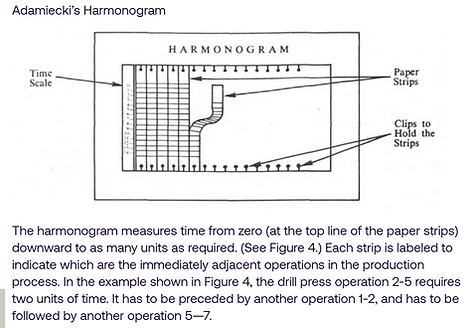

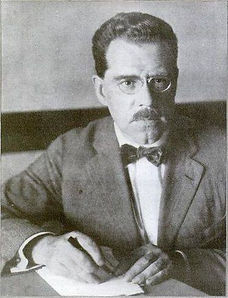
Harmonogram
The first historically relevant year for the development of project management software was 1896, marked by the introduction of the Harmonogram. Polish economist Karol Adamiecki attempted to display task development in a floating chart and laid the foundation for project management software as it is today. It is a visual representation of tasks and their interdependencies, allowing for efficient project planning and management.
Dependencies
Let’s say you’re doing a construction project and have to build, plaster and paint a wall. The plastering can’t start until the wall has been built, and the wall can’t be painted until the plaster is dry. As well as internal, we also need to consider the external dependencies which may affect our project. In the previous example, the construction company building a wall may rely on third-party suppliers for building materials, and before building can start they will need licences and planning permission.
-
Finish-to-Start: The first task needs to be complete before the second task can start, as per the example above
-
Finish-to-Finish: The second task can’t be finished until the first task has been done. For example, wires can be fitted into the wall, but you can’t switch the electricity on until they’ve been inspected
-
Start-to-Start: The following task can’t commence until the first task has started. For example, a concrete floor can’t start to be levelled until the concrete has started pouring into the designated space
-
Start-to-Finish: The first task has to start before the second task can be completed. For example, a new software installation has to start before the old installation can be stopped

Risk register
A risk register is a centralized document—often a table or spreadsheet—used in risk management to identify, assess, and monitor potential threats and opportunities to a project or organization. It acts as a live repository detailing each risk's description, likelihood, impact, owner, and plan to fix the issue.

The main disadvantages of a risk register are that it often becomes a static, ignored document rather than a dynamic management tool, leading to risks being managed in silos rather than as part of strategic decision-making.
Stakhanovite Movement

The Stakhanovite movement was a 1930s Soviet propaganda campaign and labor initiative that encouraged workers to emulate Aleksei Stakhanov, who reportedly mined 102 tonnes of coal in six hours—14 times the quota. It aimed to rapidly increase industrial production through hard work, technical skill, and state-sponsored competition.
It was a state-sponsored initiative to boost productivity, rewarding record-breaking workers with higher pay, prestige, improved housing, and luxury goods. Critics noted it caused high stress and created unrealistic production quotas, and in later years, the achievements were criticized as having been staged.

Critical Path Method
The critical path method (CPM), or critical path analysis (CPA), is an algorithm for scheduling a set of project activities. A critical path is determined by identifying the longest stretch of dependent activities and measuring the time required to complete them from start to finish. It is commonly used in conjunction with the program evaluation and review technique (PERT). The CPM is a project-modeling technique
developed in the late 1950s by Morgan R. Walker of DuPont and James E. Kelley Jr. of Remington Rand. The precursors of what came to be known as critical path were developed and put into practice by DuPont between 1940 and 1943 and contributed to the success of the Manhattan Project. "Crash duration" is a term referring to the shortest possible time for which an activity can be scheduled. It can be achieved by shifting more resources towards the completion of that activity, resulting in decreased time spent and often a reduced quality of work, as the premium is set on speed.

Program evaluation and review technique
The program evaluation and review technique (PERT) is a statistical tool used in project management, which was designed to analyze and represent the tasks involved in completing a given project. PERT was originally developed by Charles E. Clark for the United States Navy in 1958; it is commonly used in conjunction with the Critical Path Method (CPM), which was also introduced in 1958.
-
There can be potentially hundreds or thousands of activities and individual dependency relationships.
-
PERT is not easy to scale down for smaller projects.
-
The network charts tend to be large and unwieldy, requiring several pages to print and requiring specially-sized paper.
-
The lack of a timeframe on most PERT/CPM charts makes it harder to show status, although colours can help, e.g., specific colour for completed nodes.
YouTube began as a dating website; Netflix used to mail people movie rentals on DVDs; Amazon started out selling books and now leads the world in cloud computing. Even the project management software juggernaut Slack began as a chat feature inside a video game. Where many large companies in the 20th century planned every step of their projects in advance, today expectations have shifted away from perfectly sequenced plans to faster pivots between products and even business models. Explore this shift, then discuss with your team: is it better to have a rigid map that might be wrong or no map at all and a very fast pair of shoes?

waterfall method
The Waterfall project management methodology is a linear, sequential approach where project phases—requirements, design, implementation, testing, deployment, and maintenance—must be completed one at a time. It emphasizes thorough upfront planning, clear documentation, and strict stage gates, making it ideal for projects with well-defined requirements.
Waterfall is a linear approach to software development. In a true Waterfall development project, each of these represents a distinct stage of software development, and each stage generally finishes before the

Command-Control
In management, Command-and-Control is a traditional, top-down leadership style where decision-making authority is centralized at the highest levels. It is characterized by strict hierarchies, formal chains of command, and a focus on discipline and compliance rather than collaboration or employee autonomy. This authoritarian style has benefits and disadvantages. It reminds me of the Roman political position dictator which was put in use during times of war to centralize decision-making.
one can begin. There is also typically a stage gate between each; for example, requirements must be reviewed and approved by the customer before design can begin. One area which almost always falls short is the effectiveness of requirements. If the requirements for advancement to the next stage was off, then the project could go completely skewed.
Drawbacks:
-
Stifled Innovation: Strict top-down orders can discourage employees from sharing new ideas or thinking creatively.
-
Lower Engagement: Employees may feel micromanaged and undervalued, leading to higher turnover and decreased morale.
-
Slow Adaptation: Rigid structures struggle to pivot quickly in response to rapid technological changes or shifting market demands.
Advantages:
-
Military Operations: Where quick, decisive action and absolute coordination are required for mission success.
-
Emergency Response: Organizations like FEMA use established command structures because they respond roughly 60% more effectively in crises.
-
Regulated Industries: Manufacturing, finance, and healthcare often use elements of this style to enforce strict regulatory compliance and safety protocols.
Toyota Production System
The Toyota Production System (TPS), also originally called "Just-in-time production", is an integrated socio-technical management philosophy designed to achieve the highest quality, lowest cost, and shortest lead time by systematically eliminating waste. Developed by Taiichi Ohno and Eiji Toyoda between 1948 and 1975, it serves as the precursor to what is now globally known as "Lean Manufacturing".
-
Just-in-Time (JIT): Making only what is needed, when it is needed, and in the amount needed. It relies on a "Pull" system—often using Kanban cards—where production is triggered by actual customer demand rather than forecasts.
-
Jidoka (Autonomation): "Automation with a human touch." It involves designing equipment to detect abnormalities and stop automatically. This empowers workers to "pull the Andon cord" to stop the entire line if a problem is spotted, ensuring quality is built into the process rather than inspected later.
The main objectives of the TPS are to design out overburden (muri) and inconsistency
(mura), and to eliminate waste (muda).
-
Waste of overproduction (largest waste)
-
Waste of time on hand (waiting)
-
Waste of transportation
-
Waste of processing itself
-
Waste of excess inventory
-
Waste of movement
-
Waste of making defective products
-
Waste of underutilized workers

Chaos engineering
Agile Manifesto
Chaos engineering is the discipline of experimenting on a system in order to build confidence in the system's capability to withstand turbulent conditions in production. I wonder if this can be used concurrently risk register.
-
Hypothesis-Driven: Define a "steady state" and test what happens when a variable changes (e.g., "service A will stay functional if database B lags").
-
Real-world Events: Simulate real-world failures, such as server failures, network disruptions, or unexpected traffic spikes.
-
Production Testing: Run experiments in production to test how the system truly behaves under real conditions.
-
Minimizing Blast Radius: Conduct experiments in a controlled manner to avoid unexpected widespread disruption.


The Agile Manifesto is a foundational document created in February 2001 by 17 software developers at a ski resort in Snowbird, Utah. It was established as a "rallying cry" against "heavyweight," documentation-driven development processes like the Waterfall model. During the 1990s, a number of lightweight software development methods evolved in reaction to the prevailing heavyweight methods (often referred to collectively as waterfall) that critics described as overly regulated, planned, and micromanaged.
The manifesto for agile software development reads:
We are uncovering better ways of developing software by doing it and helping others do it. Through this work we have come to value:
-
Individuals and interactions over processes and tools
-
Working software over comprehensive documentation
-
Customer collaboration over contract negotiation
-
Responding to change over following a plan
Six Sigma
Six Sigma is a data-driven, disciplined methodology designed to improve business processes by identifying and removing the causes of defects and minimizing variability. Originally developed by Motorola in 1986 and popularized by Jack Welch at General Electric, it aims for "near-perfection," statistically defined as no more than 3.4 defects per million opportunities.
Six Sigma typically follows one of two five-step frameworks depending on the project's goal:

-
DMAIC (Define, Measure, Analyze, Improve, Control): Used to optimize and improve existing business processes.
-
Define: Identify the problem, project goals, and customer requirements.
-
Measure: Collect baseline data on current process performance.
-
Analyze: Use statistical tools to identify the root cause of defects or variation.
-
Improve: Develop and implement solutions to eliminate these root causes.
-
Control: Monitor the new process to ensure improvements are sustained.
-
-
DMADV (Define, Measure, Analyze, Design, Verify): Also known as Design for Six Sigma (DFSS), this is used when creating entirely new processes or products to meet Six Sigma standards from the start.
Sashimi Model
The Three Ways
The Three Ways refer to the core principles of DevOps as popularized by Gene Kim in books like The Phoenix Project and The DevOps Handbook. The Three Ways focus on the cultural and systemic changes needed to make that delivery reliable and sustainable.
The Sashimi Model is a software development methodology that modifies the traditional Waterfall Model by allowing phases to overlap. Named after the Japanese style of serving raw fish in overlapping slices, this model acknowledges that project stages (like requirements, design, and implementation) often bleed into one another in real-world development. Because phases overlap, teams can discover issues early. For example, starting implementation while still in the design phase can reveal technical flaws that require design adjustments. The Sashimi Model is best suited for medium-sized projects where the team is experienced and requirements are relatively stable but may need minor refinements as the technical work begins. It acts as a middle ground for teams that find the Waterfall Model too rigid but aren't fully committed to a high-speed Agile environment.


The First Way: Principles of Flow: focuses on the left-to-right flow of work from Development to Operations. To move work through the value stream as quickly as possible without creating bottlenecks.
The Second Way: Principles of Feedback: creating right-to-left feedback loops at every stage of the process. To shorten and amplify feedback so that problems are detected and fixed immediately.
The Third Way: Principles of Continuous Learning: creating a culture of experimentation and learning. To foster an environment where taking risks and learning from failure is encouraged, and repetition leads to mastery.

Even before Gantt charts and the waterfall method, there was Frederick Taylor’s Principles of Scientific Management. Taylor thought of workers as gears in a machine; he used stopwatches to measure the “one best way” to get to the end of a task. Explore the related concepts below, then discuss with your team: in our age of algorithmic management and remote work monitoring, have we returned to the “stopwatch” era? How would you want to be managed?
“The Phoenix Project” Philosophy
The story is centered around Parts Unlimited, a fictitious automotive parts manufacturer that’s lagging behind its competitors and suffering from declining profits and share prices. The lead character, Bill Palmer, had just been promoted to the Vice President of IT Operations, after the former VP and Chief Information Officer were asked to leave. Bill reluctantly took on the role, only to find himself besieged by endless problems and seemingly-impossible goals. The Phoenix project was supposed to help Parts Unlimited to catch up with its competitors, but it was way over budget and schedule after $20mil and 3 years of development. Bill’s top priority was to ensure that the existing IT systems operated reliably, so the team could focus on the successful deployment of Phoenix in a few weeks. He soon realized how impossible this goal was, all leading to trap Parts Unlimited in an IT “spiral of death”.

Frederick Taylor’s Principles of Scientific Management (1911), often called "Taylorism," revolutionized industrial efficiency by replacing traditional "rule-of-thumb" methods with a systematic, evidence-based approach to labor. Taylor argued that the principal object of management should be "maximum prosperity" for both the employer (high dividends and business excellence) and the employee (high wages and the development of their highest state of efficiency).
Taylor’s framework is built upon four fundamental pillars designed to maximize prosperity for both the employer and the employee:
-
Science, Not Rule of Thumb: Replace trial-and-error work methods with a "science" for every element of a person's work. This is achieved through time and motion studies to determine the "one best way" to perform a task.
2. Scientific Selection and Training: Managers should scientifically select, train, and develop each worker rather than letting them train themselves. This ensures that workers are matched to tasks that best fit their natural abilities.
3. Cooperation Between Management and Workers: Management must cooperate with workers to ensure all work is being done in accordance with the scientifically developed principles. Taylor believed that mutual cooperation would eliminate the "soldiering" (deliberate slowing down) common in factories.
4. Equal Division of Responsibility: Work and responsibility should be divided almost equally between managers and workers. Managers take over the "planning" and "thinking" for which they are better suited, while workers focus on the "doing" or execution of tasks.
The "stopwatch era" is the popular nickname for the peak of Taylorism (Scientific Management) during the early 20th century. It refers to the period when managers began using stopwatches to timing every individual movement of a worker to find the "one best way" to perform a task.
One of the positive trends that remained after Covid-19 is hybrid working and over 78% of employees in the UK are reporting better work-life balance. For employers, hybrid working has saved money on overhead and gained access to talent from a wider geographical span. But, working from home is not about playing hooky. This article examines what are the boundaries for monitoring that should be in place. No surprising, 4/10 don't approve of monitoring remote workers.
The data showed a spectrum of opinion. At first glance, it appears the largest proportion (39.2%) felt that none of the measures were acceptable, while 5.6% said they didn’t know. However, over half (55.3%) agreed with at least one of the eight measures in Figure 1, despite not having a strong preference for a particular example (Figure 2). Even when asked to think specifically about employees working from home on laptops, bosses were divided.


For these efficiency and ethical debates, context matters greatly. The three least accepted measures relate to recording screenshots and randomly recording activities. Bosses are uncomfortable with the idea of randomly collecting more information than they need to assess their employees’ performance or wellbeing.
Those at organisations where no one works from home appear less likely to trust employees to do so. They were more likely to agree than those with over three-quarters people regularly working from home that it’s fine to record screenshots or track how long employees use their laptops.
HR respondents were less comfortable than non-HR respondents about using technology to monitor employees who are working remotely from home (41.3% vs 35.7% said none of these measures were acceptable).
The majority (57.7%) said their organisations don’t use software to monitor home workers’ productivity, while 12% said they didn’t know. In general people don't like the "big brother" feeling and worried about their privacy.
Taylorism and the Four Principles
Taylor essentially took the "art" out of craftsmanship and replaced it with a standardized manual. Before Taylor, a worker was an artisan who owned their process and tools. After Taylor, the process belonged to the company; the worker was simply a "hand" hired to execute it.
Time and Motion Studies: Consultants (the first "efficiency experts") would stand over workers, breaking down jobs into seconds and fractions of seconds. The goal was to eliminate "wasteful" movement, like reaching too far for a tool.
De-skilling: By breaking complex crafts into tiny, timed repeatable steps, companies could hire unskilled labor to do specific parts of a job, making workers easily replaceable.

The "Human Machine": The philosophy treated employees as biological components of a larger machine. If a worker could move faster, the "science" demanded they do so to reach maximum output.
Piece-Rate Pay: Wages were strictly tied to the stopwatch. If you met the "standard" time, you got paid; if you exceeded it, you got a bonus; if you fell behind, you were often fired.
Max Weber’s Bureaucracy
Weber’s Bureaucracy Theory (1922) argued that a formal, rigid, and impersonal system was the most rational and efficient way to organize human activity at scale. Despite advocating for its efficiency, Weber famously warned of the "Iron Cage." He feared that a world governed entirely by rationalized, bureaucratic rules would strip away human passion and individual freedom, leaving people trapped in a system that values cold efficiency over human spirit.

The 6 Principles of Weber’s "Ideal" Bureaucracy: Weber outlined six core pillars designed to eliminate favoritism and ensure efficiency.
-
Hierarchical Management Structure: A clearly defined "chain of command" where each level of management is responsible for its staff and answerable to the level above.
-
Division of Labor (Specialization): Tasks are broken down into simple, routine jobs assigned to employees based on their specific expertise and technical competencies.
-
Formal Selection Process: Employees are hired and promoted based on merit, education, and experience rather than personal connections or nepotism.
-
Formal Rules and Regulations: All administrative actions and decisions are governed by a consistent system of written rules to ensure uniformity and reduce uncertainty.
-
Impersonality: Relationships between employees are strictly professional. Decisions are based on rational evidence and official protocols, not personal feelings or individual differences.
-
Career Orientation: Employees are expected to view their role as a lifelong career. In return for loyalty and performance, the organization provides job security and structured advancement.
Ford's Assembly Line
Introduced in 1913 at the Highland Park plant in Michigan, Ford's assembly line represents the most famous modernization in product management and efficiency in the 20th century. Henry Ford shifted manufacturing from custom craftsmanship to a system of continuous flow that dramatically lowered the cost of cars and his method was adopted to many industries to popularize many electric consumer goods. This innovation was the "pièce de résistance" of Ford's efficiency crusade, reducing the time to build a Model T from over 12 hours to just 93 minutes. Workers however actually hated the working conditions.

The assembly was broken into 84 discrete steps. Each of the 140 workers on the line was trained to perform just one or two repetitive tasks, such as installing a specific bolt or component. The price of a Model T dropped from $850 in 1908 to as low as $260 by 1924, making it affordable for the middle class. To combat the high turnover caused by the monotonous work, Ford introduced the $5 workday in 1914—more than double the average wage at the time—enabling his own workers to become customers.


Total Quality Management (TQM)
Total Quality Management is an organization-wide philosophy centered on continuous improvement and customer satisfaction. Unlike early manufacturing models that relied on a separate "Quality Control" department to catch errors at the end, TQM aims to "do it right the first time" by making quality everyone's job.
In Fords model, workers were often treated as "parts of the machine" and were not expected to offer feedback. The only concern was efficiency. Post WWII, American statistician W. Edwards Deming taught Japanese manufacturers (like Toyota) that improving quality naturally leads to lower costs and higher productivity. The focus shifted from efficiency to quality. When Japanese cars began outperforming American ones, companies like Ford "rediscovered" Deming's principles. Ford adopted the slogan "Quality is Job 1" and shifted toward TQM to regain its competitive edge.
No single methodology is perfect and as the times change and people settle into complacency, it is necessary to shift the focus and examine product management issues with new perspective. With the introduction of AI, will efficiency increase, or will people lose the will to invent new ways to improve.
Managers need people to manage—but those people can be frustratingly slow and easily distracted. Explore the psychological and structural “laws” that supposedly govern human effort, then discuss with your team: how do they apply to your preparations for this competition?
The Hawthorne Effect
The Hawthorne Effect is the phenomenon where individuals improve or modify their behavior simply because they know they are being observed. It originated from a series of experiments conducted between 1924 and 1932 at the Western Electric Hawthorne Works plant in Illinois. Researchers, including Harvard's Elton Mayo, initially set out to study how physical conditions—specifically lighting—affected productivity.
-
Brighter Lights: Productivity went up.
-
Dimmer Lights: Productivity also went up.
-
Return to Normal: Productivity reached its highest level yet.

They concluded that the increase wasn't due to the light itself, but because the workers felt special and valued by being part of a study. The attention they received from researchers and managers acted as a more powerful motivator than any physical environmental change. The observations at Hawthorne birthed the Human Relations Movement. It revealed that informal "cliques" and peer groups often have more influence on productivity than official management rules. It proved that listening to employees and involving them in decisions boosts morale and output.
Coined by Douglas Hofstadter in his 1979 Pulitzer Prize-winning book, Gödel, Escher, Bach: An Eternal Golden Braid, the law is a self-referential joke about the difficulty of estimating the time required to complete complex tasks. It highlights the futility of traditional planning, as tasks often exceed even the most pessimistic projections. It is widely used in software, technology, and construction to emphasize that "buffer" time for tasks is often inadequate.
Hofstadter's Law
Hofstadter’s Law hits harder than most leaders expect: It doesn’t just thrive under pressure. It thrives in the absence of pressure, too. In companies with low trust or command-and-control leadership, teams learn to hide the truth. But in high-trust, high-autonomy environments, it’s often the lack of urgency or structure that dulls the signals.
The 90-90 Rule
"The first 90 percent of the code accounts for the first 90 percent of the development time. The remaining 10 percent of the code accounts for the other 90 percent of the development time." The rule identifies that while the bulk of a project’s visible progress happens quickly, the final stretch involves "hidden" complexities that are often ignored during initial estimation.
A different version, often called the 90/90/1 Rule (created by Robin Sharma), is used in productivity management to drive results on mission-critical goals. It suggests that for 90 days, you should spend the first 90 minutes of your workday on your 1 most important goal

Conway’s Law
Conway’s Law is an observation in systems design and management that suggests a system's technical architecture will inevitably mirror the communication structure of the organization that created it. It is based on a mirror effect in which if an organization is divided into four isolated teams, they will likely produce a system with four distinct, potentially disjointed modules.
This strategy involves intentionally designing your team structure to achieve a desired technical architecture. For example, if you want a modular "microservices" architecture, you should create small, autonomous, cross-functional teams rather than large, siloed departments. As teams grow, communication paths increase exponentially. Management rules like Amazon’s "Two-Pizza Rule" (keeping teams small enough to be fed by two pizzas) help maintain the clear communication necessary for clean system design.

Putt’s Law
Putt’s Law is a satirical but sharp observation about the hierarchy of technical organizations. Putt's Law states that "Technology is dominated by two types of people: those who understand what they do not manage, and those who manage what they do not understand." Basically saying that senior managers lack the technical skills to execute the plan. "Every technical hierarchy eventually develops a competence inversion: Every proficiency is eventually replaced by a technical incompetence."
Previously in WSC, we studied how Apple is a company that prides itself on breaking this rule, that all senior managers must have strong expertise and that no manager simply manages.

Illich’s Law
Illich’s Law, also known as the Law of Diminishing Returns in productivity, states that after a certain point, the more effort you put into a task, the less productive you become. Basically, if you study too much, you end up not retaining as much. These laws are somehow all connected. The Illich Law supports the 90-90 rule where the last 10% just take so much extra time due to diminishing productivity.

Laborit's Law
Named after French neurobiologist Henri Laborit, this law suggests our brains are evolutionarily hardwired to avoid stress and conserve energy to seek the path of least resistance. Also known as the Law of Least Effort, is a productivity principle stating that human beings naturally prioritize easy, enjoyable tasks that provide immediate satisfaction over difficult or stressful ones. Why we need to start the day by eating the frog. Our bodies naturally seek "quick wins" to get a dopamine boost. Like scrolling through shorts to get instant dose of fun. This is a caution to all of us in the social media generation to not let constant media gratification alter our behavior, so much that we lose the will and drive to solve tougher problems and think critically,


Brooks’ Law
Brooks’ Law is a famous principle in software development and project management which states: "Adding manpower to a late software project makes it later." Like the Chinese saying, "Too many cooks, spoils the soup." Coined by Fred Brooks in his 1975 book, The Mythical Man-Month, the law challenges the common assumption that progress is directly proportional to the number of people working on a task.
Onboarding/Ramp-up Time: New team members aren't productive immediately. They require training which takes up the time of experienced people.
Communication Overhead: As team size communications takes more time. More people = more meetings and less time for actual work.
Limited Divisibility: Some tasks simply cannot be shared. Brooks famously illustrated this by noting that while it takes one woman nine months to make a baby, "nine women cannot make a baby in one month."
Maybe studying just 20% of this curriculum will get you a high enough score. The pareto principle suggests that, in any given process, 80% of outcomes come from 20% of inputs. In a project, it implies 20% of the effort can lead to 80% of the results. Discuss with your team: are most people overworking most of the time?
The Pareto Principle was named after Italian economist Vilfredo Pareto who, in the late 19th Century observed that 80% of the wealth in Italy was owned by 20% of the people.
The Pareto Principle is often touted as a powerful tool for productivity and business management; however, it has received a great amount of criticism for likely being more the result of statistical manipulation than a “universal law.” This principle requires and enables us to spot the few important things that are happening and ignore the mass of unimportant things.
In the early 1950s, the psychologist Joseph Juran expanded on this idea: “vital few” and “useful many” or “trivial many” to refer to those few contributions that result in the bulk of the effect
-
80% of profits come from 20 % of the products or services a company sells.
-
Fixing the top 20 % of the most reported bugs in a software program also eliminates 80 % of related errors and crashes.
-
Wearing 20 % of one’s clothes 80 % of the time
Proponents of Pareto believe that this law should be applied to relationships and other things in life too, meaning we should put a value of each of our friendships and evaluate how much they contribute to our productivity or end goals. While, it may very well be true that only a small amount of our actual connections in life amount to anything much less change our lives, it is not to say that any of them are insignificant.
While this section's laws, processes, and systems ,theorized and practiced by some of the most intelligent and ambitious people in history, have taught us numerous ways to be more productive, efficient, waste less, have higher quality, build stronger culture, ensure higher results, make more money and readapt and "be more agile", it doesn't value the most important aspect of human life - mistakes are valuable and unique. Being goal-oriented is great, but don't miss out on all the experiences along the way. You never know where your path will lead.